Friday, July 30, 2010
Monday, July 5, 2010
Judi Barrett's Awards Won
GIS Exercise 3
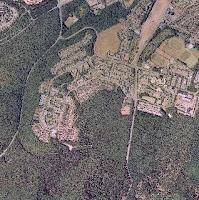
GIS Exercise 3 - digitizing an aerial image
was the object of this exercise is an aerial view of The University of Kaiserslautern and the surrounding area by using Quantum GIS digitized. The digitization of the aerial photograph should be comprehensively and superimposition.
Step 1.1 - Digitizing
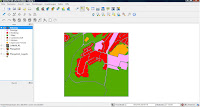
Man first uploads the image in Quantum GIS. Then activate the formula bar "go digital. There are various tools (line, point, polygon) to edit the image. Choose "digitize Polygon" tool.
Step 1.2
So that the individual polygons are exactly together and not overlap, select "Project Settings", then "General" tab: Here you turn on the "Capture Options" to "avoid duplication of polygons" and. The surfaces merge together so.
Step 2 - Balance
area is chosen for "vector" "Geoverarbeitungswerkzeuge" and then "dissolve". It opens a new window. A new layer is created and added. Thus, the entire areas are combined into a single area and then saved as a record of use. First sind die Farben der Flächen falsch. Daher muss man als nächstes den Stil des Nutzungslayers speichern, indem man durch Rechtsklick zu den Eigenschaften gelangt und dort "Stil speichern" wählt. den gespeicherten Stil lädt man nun im Lyer der Flächenbilanz hoch. Das bewirkt, dass die Flächenangaben jeweils für die einzelnen Kategorien generiert werden und die Farben angepasst sind.
Als nächstes öffnet man die Attributtabelle des Nutzungslayers (im Bearbeitungsmodus!) und wählt dann den Feldrechner: Einstellungen:
Ausgabefelname:"Fläche", Dezimalzahl, Genauigkeit 2
Im linken Feld wählt man "Fläche", im rechten Feld "Alle Werte"; dann drückt man das Feld "Fläche" -> Ok
appear in the attribute table now has a new column. These values are added together and then give a value of about 3, 99 million.
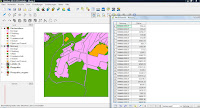
When you create the first balance sheet problems have occurred. The cause of the problem was that not all areas were colored. Repeated follow the lines but then it worked. Another problem was that were dyed to create the balance in both surface layers all the same fields. 
GIS Exercise 3 - digitizing an aerial image
was the object of this exercise is an aerial view of The University of Kaiserslautern and the surrounding area by using Quantum GIS digitized. The digitization of the aerial photograph should be comprehensively and superimposition.
Step 1.1 - Digitizing
Man first uploads the image in Quantum GIS. Then activate the formula bar "go digital. There are various tools (line, point, polygon) to edit the image. Choose "digitize Polygon" tool.

Step 1.2
So that the individual polygons are exactly together and not overlap, select "Project Settings", then "General" tab: Here you turn on the "Capture Options" to "avoid duplication of polygons" and. The surfaces merge together so.

Step 2 - Balance
area is chosen for "vector" "Geoverarbeitungswerkzeuge" and then "dissolve". It opens a new window. A new layer is created and added. Thus, the entire areas are combined into a single area and then saved as a record of use. First sind die Farben der Flächen falsch. Daher muss man als nächstes den Stil des Nutzungslayers speichern, indem man durch Rechtsklick zu den Eigenschaften gelangt und dort "Stil speichern" wählt. den gespeicherten Stil lädt man nun im Lyer der Flächenbilanz hoch. Das bewirkt, dass die Flächenangaben jeweils für die einzelnen Kategorien generiert werden und die Farben angepasst sind.
Als nächstes öffnet man die Attributtabelle des Nutzungslayers (im Bearbeitungsmodus!) und wählt dann den Feldrechner: Einstellungen:
Ausgabefelname:"Fläche", Dezimalzahl, Genauigkeit 2
Im linken Feld wählt man "Fläche", im rechten Feld "Alle Werte"; dann drückt man das Feld "Fläche" -> Ok
appear in the attribute table now has a new column. These values are added together and then give a value of about 3, 99 million.

When you create the first balance sheet problems have occurred. The cause of the problem was that not all areas were colored. Repeated follow the lines but then it worked. Another problem was that were dyed to create the balance in both surface layers all the same fields.
Tuesday, June 15, 2010
Allusions In The Matrix
GIS / statistical exercise
1.Aufgabenteil:
task was a town in Rhineland-Palatinate and select the least of these 30 areas with land prices in Google Earth to identify. Data on the prices you get on the website BORIS.RLP
City: Gerolstein
areas: 42
Step 1:
First, you open the homepage of BORIS.RLP and searches the selected city. Next, one makes a screenshot of the city, I have chosen Gerolstein.
Furthermore you open Google Earth and zoom in there as well to the city to be processed.


Step 2: Next, add
you insert using the tool "image overlay, a screenshot of the newly created city in Google Earth and to adjust that by Sklaieren to the air picture.

Step 3: Then
can now surround the tool "Polygon Add the areas with different land prices. The areas with the corresponding prices are BORIS.RLP read.

Step 4:
The polygons are now being processed. Color and height are selected appropriate to the floor price (€ / m²). The lower areas are green and flat, the more expensive higher and orange to red
<30€/m² – Dunkelgrün
30 € / m² - 39 € / m² - Green
40 € / m² - 49 € / m² - Yellow
50 € / m² - 59 € / m² - yolk yellow
60 € / m² - 90 € / m² - Orange
> 90 € / m² - Red
be worked selects the polygons in which you right-click Properties. Here, the name can be changed, select the color and height are specified. At the height choose "Relative to ground" then the desired height and then dials also have "Extend sides to ground."


2.Aufgabenteil:
was the second part of this exercise for extra safety control.
original list: 50, 45, 50, 45, 40, 45, 30, 32, 48, 48, 58, 40, 18, 34, 60, 60, 50, 32, 42, 18, 70, 50, 46, 42, 32, 46, 40, 55, 55, 180, 180, 45, 48, 38, 70, 50, 45, 50, 90, 50, 70, 45
(n = 42)
stem-leaf plot

Ordered list: 18, 18, 30, 32, 32, 32, 34, 38, 40, 40, 40, 42, 42, 45, 45, 45, 45, 45, 45, 46, 46, 48, 48, 48, 50, 50, 50, 50, 50, 50, 50, 55, 55, 58, 60, 60, 70, 70, 70, 90, 180, 180
Minimum: 18 Maximum
: 180
Wingspan: 162
mode: 50 (most frequent value)
median: 47
average: 52 (52.19)
outliers: 18, 180
Graph

Disskussion:
With the help of Google Earth shows land prices in Gerolstein color. This representation shows that the price of land in the city center are the most expensive, the suburbs are becoming more favorable toward it. In general, land prices relatively low. Except for two areas are located in the center. The price of land here differs greatly from the other prices. This could be because the center is the most attractive place to live. The demand is higher.
location parameter:
The definitions of location parameters are intended to describe the location of the sample elements or the elements of the population in terms of measurement scale. The descriptive statistics used to as location parameters (central tendency) of a distribution:
• Arithmetic mean
• Quantile: median, quartiles, deciles, percentiles
• Mode
• Geometric mean
• Harmonic mean
For random variables is called the expected value
scattering parameters:
Under a measure of variability or dispersion measure (also scattering parameter) is defined as statistical indicators, through their investigation, statements about the distribution of, for example, from weighing and counting dating, measurements taken around the center . let The descriptive statistics to describe the scattering (also variation or dispersion) with:
• empirical variance (short variance) (most important measure of dispersion) and standard deviation
• Span
• Mean absolute deviation
• Middle interquartile
In the statistical inference is if you talk von Varianz.
GIS-Statistik-Übung3_Luise.Hoffmann.372396.7z 
1.Aufgabenteil:
task was a town in Rhineland-Palatinate and select the least of these 30 areas with land prices in Google Earth to identify. Data on the prices you get on the website BORIS.RLP
City: Gerolstein
areas: 42
Step 1:
First, you open the homepage of BORIS.RLP and searches the selected city. Next, one makes a screenshot of the city, I have chosen Gerolstein.
Furthermore you open Google Earth and zoom in there as well to the city to be processed.


Step 2: Next, add
you insert using the tool "image overlay, a screenshot of the newly created city in Google Earth and to adjust that by Sklaieren to the air picture.

Step 3: Then
can now surround the tool "Polygon Add the areas with different land prices. The areas with the corresponding prices are BORIS.RLP read.

Step 4:
The polygons are now being processed. Color and height are selected appropriate to the floor price (€ / m²). The lower areas are green and flat, the more expensive higher and orange to red
<30€/m² – Dunkelgrün
30 € / m² - 39 € / m² - Green
40 € / m² - 49 € / m² - Yellow
50 € / m² - 59 € / m² - yolk yellow
60 € / m² - 90 € / m² - Orange
> 90 € / m² - Red
be worked selects the polygons in which you right-click Properties. Here, the name can be changed, select the color and height are specified. At the height choose "Relative to ground" then the desired height and then dials also have "Extend sides to ground."


2.Aufgabenteil:
was the second part of this exercise for extra safety control.
original list: 50, 45, 50, 45, 40, 45, 30, 32, 48, 48, 58, 40, 18, 34, 60, 60, 50, 32, 42, 18, 70, 50, 46, 42, 32, 46, 40, 55, 55, 180, 180, 45, 48, 38, 70, 50, 45, 50, 90, 50, 70, 45
(n = 42)
stem-leaf plot

Ordered list: 18, 18, 30, 32, 32, 32, 34, 38, 40, 40, 40, 42, 42, 45, 45, 45, 45, 45, 45, 46, 46, 48, 48, 48, 50, 50, 50, 50, 50, 50, 50, 55, 55, 58, 60, 60, 70, 70, 70, 90, 180, 180
Minimum: 18 Maximum
: 180
Wingspan: 162
mode: 50 (most frequent value)
median: 47
average: 52 (52.19)
outliers: 18, 180
Graph

Disskussion:
With the help of Google Earth shows land prices in Gerolstein color. This representation shows that the price of land in the city center are the most expensive, the suburbs are becoming more favorable toward it. In general, land prices relatively low. Except for two areas are located in the center. The price of land here differs greatly from the other prices. This could be because the center is the most attractive place to live. The demand is higher.
location parameter:
The definitions of location parameters are intended to describe the location of the sample elements or the elements of the population in terms of measurement scale. The descriptive statistics used to as location parameters (central tendency) of a distribution:
• Arithmetic mean
• Quantile: median, quartiles, deciles, percentiles
• Mode
• Geometric mean
• Harmonic mean
For random variables is called the expected value
scattering parameters:
Under a measure of variability or dispersion measure (also scattering parameter) is defined as statistical indicators, through their investigation, statements about the distribution of, for example, from weighing and counting dating, measurements taken around the center . let The descriptive statistics to describe the scattering (also variation or dispersion) with:
• empirical variance (short variance) (most important measure of dispersion) and standard deviation
• Span
• Mean absolute deviation
• Middle interquartile
In the statistical inference is if you talk von Varianz.
GIS-Statistik-Übung3_Luise.Hoffmann.372396.7z
Wednesday, June 9, 2010
Denture Is Turning Black
FLUSSAUFWÄRTS
UPRIVER from APEIRON FILMS on Vimeo .
Rocko has a thoughtful day. He gets help from an unexpected quarter. His friends give him courage. Then appears Karo!
UPRIVER was produced in a few days at the Hamburg KinoKabaret 2010th
thanks pearl beach & Golden Pudel Club Hamburg.
hamburgerkino.de
apeiron-films.de
_________________________
Award at the Film salad Verden 2010: "Upstream" is a cramped, light and himself not to be taken seriously comedy. The fairy-tale history is combined with dry humor and a surreal touch.
_________________________
Cast: Nils Adolf Schulz, Hank Schmidt, Julie Pecquet, Mario Grete, Stefan Busch village, Philip Barth, Essi Sharif.
Written by: Verena school man.
Camera / Editor: Jan D. Gerlach.
Sound: Mario Grete, Dave Lojek.
Light: Philipp Barth.
Music: Stefan Rausch.
mix of music: Christian Lorenz.
Animation: Peter Gerulat.
Director / Producer: Dave Lojek.
______________________
[Ist es ein Zufall, daß gerade jetzt John Fords verschollen geglaubter Film "Upstream" in Neuseeland entdeckt wurde? tiny.cc/cwd7z ] 
UPRIVER from APEIRON FILMS on Vimeo .
Rocko has a thoughtful day. He gets help from an unexpected quarter. His friends give him courage. Then appears Karo!
UPRIVER was produced in a few days at the Hamburg KinoKabaret 2010th
thanks pearl beach & Golden Pudel Club Hamburg.
hamburgerkino.de
apeiron-films.de
_________________________
Award at the Film salad Verden 2010: "Upstream" is a cramped, light and himself not to be taken seriously comedy. The fairy-tale history is combined with dry humor and a surreal touch.
_________________________
Cast: Nils Adolf Schulz, Hank Schmidt, Julie Pecquet, Mario Grete, Stefan Busch village, Philip Barth, Essi Sharif.
Written by: Verena school man.
Camera / Editor: Jan D. Gerlach.
Sound: Mario Grete, Dave Lojek.
Light: Philipp Barth.
Music: Stefan Rausch.
mix of music: Christian Lorenz.
Animation: Peter Gerulat.
Director / Producer: Dave Lojek.
______________________
[Ist es ein Zufall, daß gerade jetzt John Fords verschollen geglaubter Film "Upstream" in Neuseeland entdeckt wurde? tiny.cc/cwd7z ]
Subscribe to:
Posts (Atom)